Using published results for the performance of state-of-the-art AI document-vector embeddings and semantic hashing I evaluated a canonical document-vector retrieval system boosted by approximate nearest neighbour search.
The results seem to show that AI augmented document vector models are still striving to significantly surpass the performance of a straight forward application of Gerard Salton's original approach.
Contents
I started out with a little project to evaluate the performance of a similarity search engine I have been working on for some time. A similarity search engine can be seen as a service which takes a query document $d_q$ as input and returns a list of document IDs $d_i$ sorted by similarity. Similarity is based on the cosine-similarity for the vector space model of information retrieval (VSM) see also Cosine Similarity and Intrinsic Dimension.
For this setting it seemed to be a decent strategy to follow the experimental approach chosen by some suitable publication. I expected that
I started with G. Hinton's and R. Salakhutdinov's (1) well known paper on semantic hashing (933 citation on Google Scholar). The authors report on a novel way to create binary hashcodes which try to preserve pairwise similarity and at the same time outperforms other approaches based on LSH and LSA. In order to achieve this performance they apply an autoencoder on document vectors based on deep learning approach. This allegedly was one of the earliest deep neural models in information retrieval, see e.g. Bhaskar and Craswell (Bhaskar:2017).
To me, more important than the deep learning approach was the setup of the reported experiments using RCV1-v2 (prepared by David Lewis (2)) and 20 newsgroups test corpora. These test corpora are also used by many of the newer publications citing Hinton et.al..
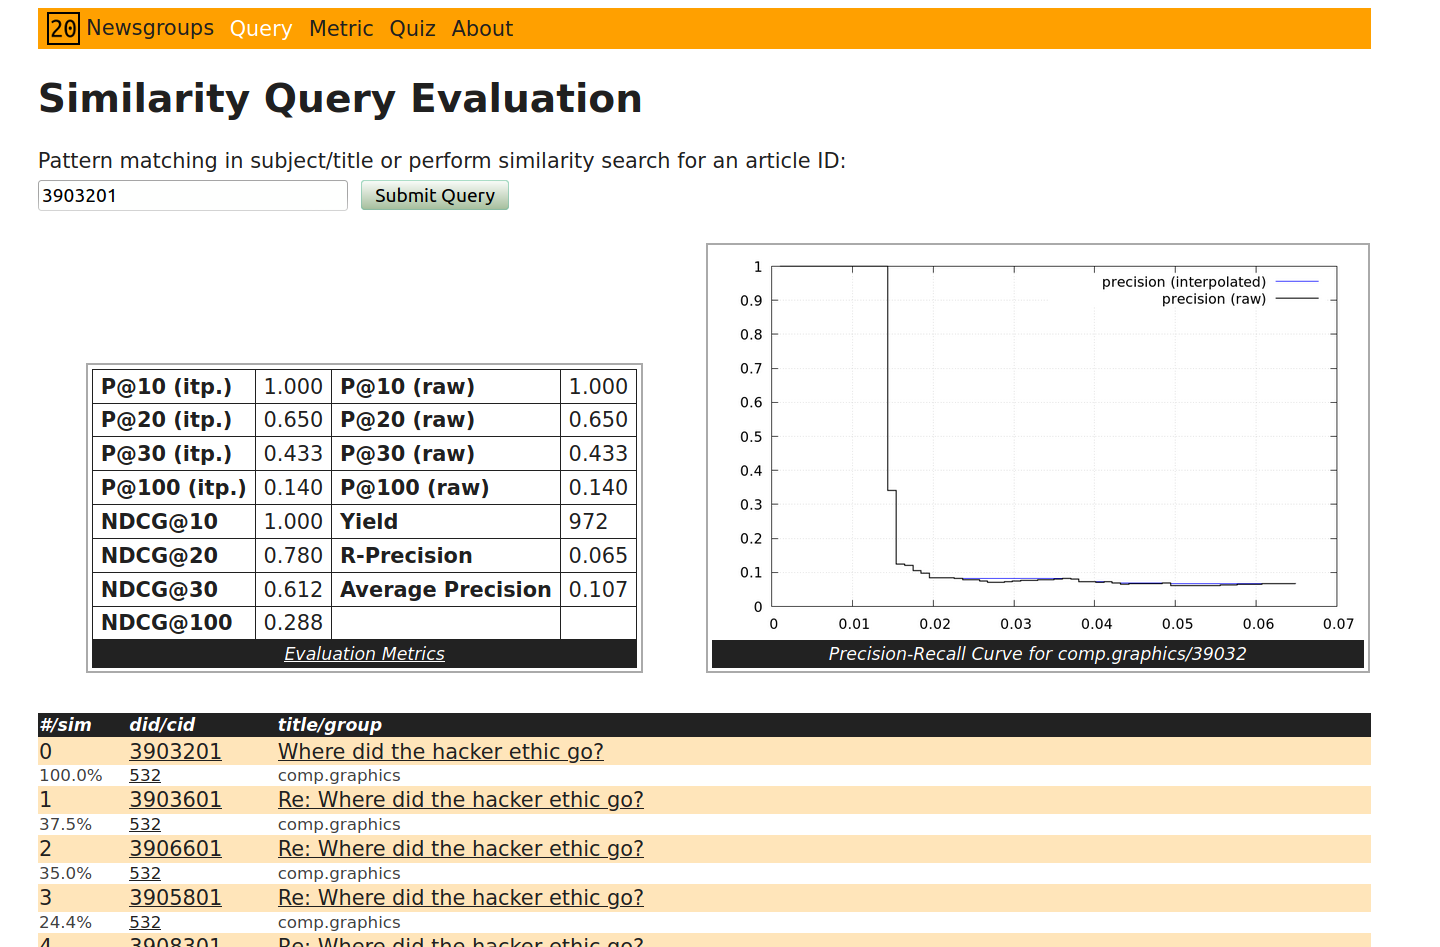
For the 20 newsgroups test corpus I created an web site where you can query for a document and evaluation metrics are calculated on the fly. Some times it is also quite interesting from a historical perspective to read some of the more than twenty years old newsgroup articles. To read the contents you have to successfully solve a little quiz. Even if the corpus is freely available for eductational purpose, I wanted to limit online access to users with some information retrieval background.
The RCV1-v2 test collection consists of 804,414 Reuters newswire stories from Reuters from a twelve month period in 1996/97. They have been manually categorized into 103 topics which are arranged in an hierachical manner. The test collection was designed for classification tasks but is also used for similarity search. Let me give you an example (first two documents in RCV1-v2 collection):
2286 E E11 M M11 M12
2287 C C24
Here I substituted the ordical topic code ECAT with E and CCAT
with C as suggested by David Lewis so that the lexiographic order
coincides with the hierarchical ordering of the tree paths. The first digit is the document
identifier (here 2286 resp. 2287). Then the hierarchical path(s) of
topics follow (e.g. C C24 for the second document). For document 2286 we have actually three paths:
E->E11M->M11M->M12where e.g. E stands for main topic ECONOMICS and the child topic E11 stands for ECONOMIC PERFORMANCE, M for MARKETS and M11 for EQUITY MARKETS.
There are in total four main topics and 99 sub topic codes (up to 3 levels of hierachy depending on main topic, e.g. 2289 C C15 C151)
| topic | description |
|---|---|
| C | ORPORATE/INDUSTRIAL |
| G | GOVERNMENT/SOCIAL |
| E | ECONOMICS |
| M | MARKETS |
The topic E11 e.g. stands for ECONOMIC PERFORMANCE and M11 for EQUITY MARKETS.
I used 20news-bydate.tar.gz (20 Newsgroups sorted by date; duplicates and some headers removed, 18,846 documents). For details see "20 Newsgroups home page.
| Newsgroup | # Docs |
|---|---|
| alt.atheism | 799 |
| comp.graphics | 973 |
| comp.os.ms-windows.misc | 985 |
| comp.sys.ibm.pc.hardware | 982 |
| comp.sys.mac.hardware | 963 |
| comp.windows.x | 988 |
| misc.forsale | 975 |
| rec.autos | 990 |
| rec.motorcycles | 996 |
| rec.sport.baseball | 994 |
| rec.sport.hockey | 999 |
| sci.crypt | 991 |
| sci.electronics | 984 |
| sci.med | 990 |
| sci.space | 987 |
| soc.religion.christian | 997 |
| talk.politics.guns | 910 |
| talk.politics.mideast | 940 |
| talk.politics.misc | 775 |
| talk.religion.misc | 628 |
| sum | 18,846 |
Now since we have had some introduction to the RCV1-v2 test collection let us try to understand what the authors actually calculated their experimental results. Pivotal for any Information retrieval (IR) system evaluation are the measures precision, recall and in our case the definition of relevance, see (3). Infact (1) reports a precision-recall graph. So lets take a closer look at those measures:
\begin{eqnarray} \text{Precision} &=& \frac{\text{# retrieved relevant docs}}{\text{# total retrieved docs}}\nonumber\\ &&\\ \text{Recall} &=& \frac{\text{# retrieved relevant docs}}{\text{# total relevant docs}}\nonumber \end{eqnarray}
Since a document can have more then one topic path (infact 32% or 257,000 documents have two or more topic paths and 4% or 23,000 documents have 4 or more different topic paths) the definition of relevance between two documents does not seems completely straight forward. Salakhutdinov & Hinton (1) define relevance as follows:
For this dataset, we define the relevance of one document to another to be the fraction of the topic labels that agree on the two paths from the root to the two documents.
This leaves room for interpretation, especially: How is relevance defined in the case when documents contain multiple topic paths? Without any other information from (1) I decided to apply the most simple extension to the above definition:
E.g. for the relevance between 2286 E E11 M M11 M12 and 2539 E E11 E12 we get
$$
Relevance(2286, 2539) = \frac{2}{5}=0.4
$$
Please note, that e.g. document 2286 has three paths, namely E->E1, M->M11 and M->M12 as described above.
It should be noted that other authors like Chaidaroon, Suthee and Fang, Yi (4) and Q Wang, D Zhang, L Si (5) ignore the hierachical structure of RCV1 topic labeling altogether and retain binary relevance:
... a retrieved document that shares any common test label with the query document is regarded as a relevant document.
This leads to quite high precision values, as can be seen from the experimental results in (4) and (5).
In order to calculate the recall for a query document we need to determine the total number of relevant documents in the corpus, sometimes called yield. The only consistent way to do this for RCV1-v2 seems to calculated the weighted sum of all relevant documents like this:
$$ yield(d_q):=\sum_{d\in D} relevance(d,d_q) $$
where $d_q$ is the query document and $D$ is the set of all documents in the test collection (excluding $d_q$) and relevance is calculated as the fraction of identical topic codes as detailed above. Otherwise we can never achieve 100% recall.
To speed up computation for RCV1-v2 I estimated the yield by using a sample $\hat{D}$ of size 100,000 instead of all documents $D$ in the test corpus. Also we are not querying every document but only take a sample of size 10,000.
For RCV1-v2 and 20 Newsgroups I obtain following estimates:
| Min | Q1 | Median | Q3 | Max | |
|---|---|---|---|---|---|
| RCV1-v2 value | 21,778 | 88,202 | 102,214 | 129,664 | 191,204 |
| 20 news yield | 628 | 963 | 985 | 991 | 999 |
With these numbers we can easily calculate an lower bound for the recall:
$$ Recall@100% > 0.25\cdot \frac{88,202+102,214+129,664}/{804,414} \approx 9.9 $$
So we expect the recall@100% to be at least about 10% for RCV1-v2. Similarily we see for 20 Newsgroup test corpus that recall@100% should be at least about 4%. Please note that these estimate are independent from any applied retrieval algorithm.
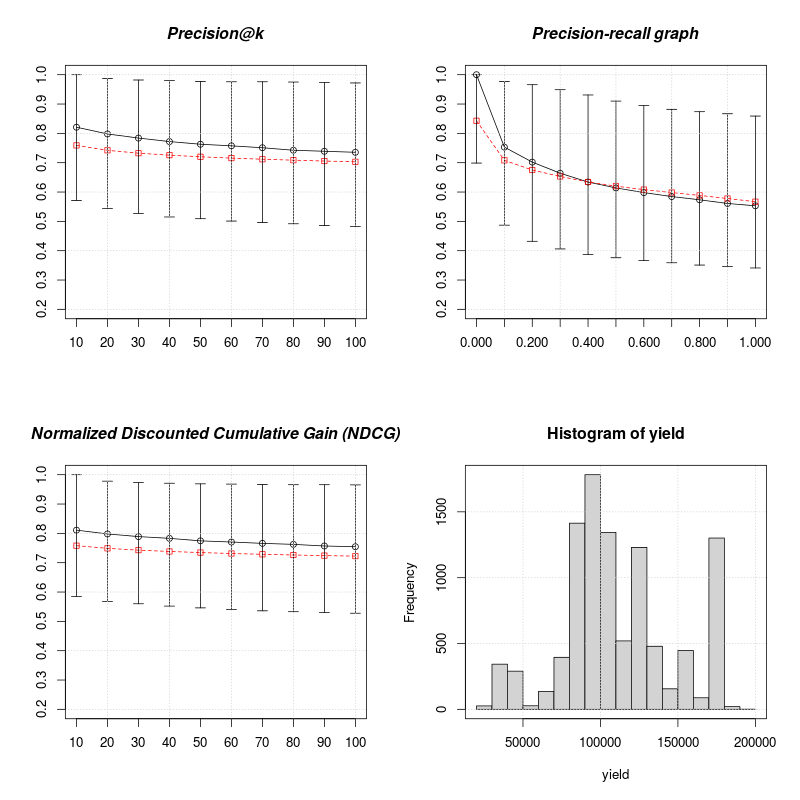
| Q1 | Median | Mean | Q3 | |
|---|---|---|---|---|
| ndcg_10 | 0.585 | 0.811 | 0.758 | 1.000 |
| ndcg_100 | 0.528 | 0.754 | 0.722 | 0.966 |
| P_k10 | 0.571 | 0.821 | 0.759 | 1.000 |
| P_k100 | 0.482 | 0.736 | 0.703 | 0.972 |
| ndcg_10 PV-DBOW (6) | NA | NA | 0.790 | NA |
| Q1 | Median | Mean | Q3 | |
|---|---|---|---|---|
| ndcg_10 | 1.000 | 1.000 | 0.969 | 1.000 |
| ndcg_100 | 0.956 | 1.000 | 0.942 | 1.000 |
| P_k10 | 1.000 | 1.000 | 0.972 | 1.000 |
| P_k100 | 0.954 | 1.000 | 0.937 | 1.000 |
| P_k100 SHTTM (5) | NA | NA | 0.8151 | NA |
| P_k100 VDSH (4) | NA | NA | 0.895 | NA |
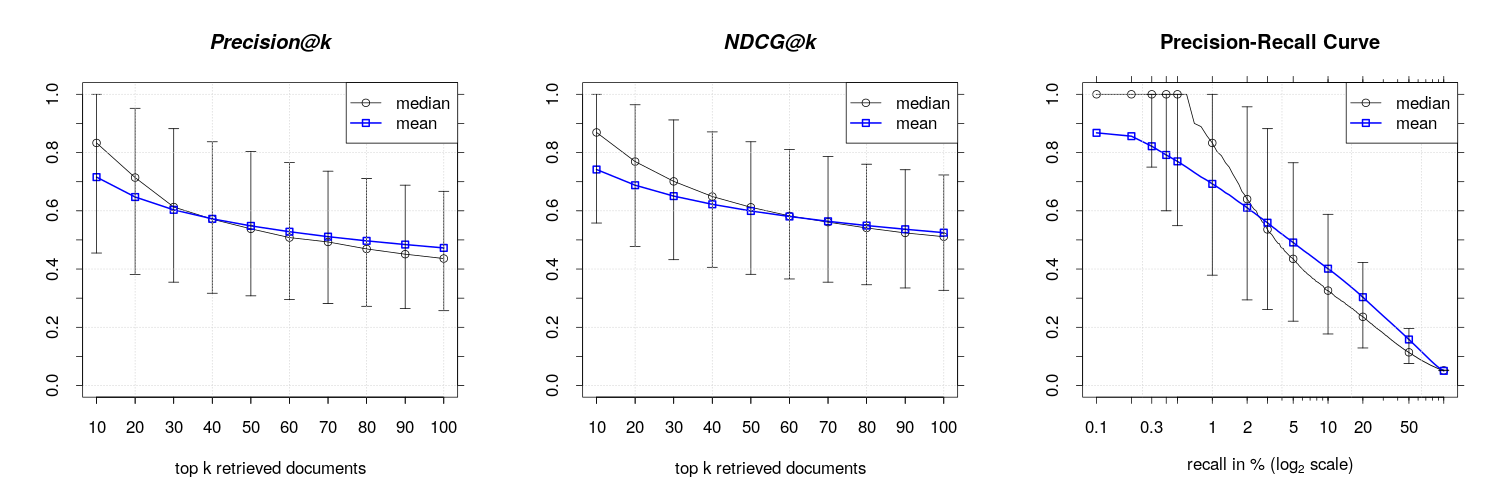
| Q1 | Median | Mean | Q3 | |
|---|---|---|---|---|
| ndcg_10 | 0.553 | 0.866 | 0.739 | 1.000 |
| ndcg_100 | 0.325 | 0.507 | 0.522 | 0.720 |
| P_k10 | 0.455 | 0.818 | 0.712 | 1.000 |
| P_k100 | 0.257 | 0.436 | 0.470 | 0.663 |
| P_k100 SHTTM (5) | NA | NA | 0.697 | NA |
| P_k100 VDSH (4) | NA | NA | 0.433 | NA |
| ndcg_10 PV-DBOW (6) | NA | NA | 0.750 | NA |
In practise it seams quite difficult to compare the results from other studies. This is due to the fact that the reproducibility of the experimental evaluations is limited, especially for the more complex text corpus RCV1-v2:
Summing the experimental results for RCV1-v2 and 20 newsgroup test corpora, it seems that an straight forward VSM approach (combined with an approximated nearest neighbour algorithm to speed up retrieval) is still competitive for similarity search. It seems to be quality wise comparable to deep learning frameworks. Naturally this is only a limited comparison and only reflects current (early 2019) results.
Bibliography
[1] Salakhutdinov, R., & Hinton, G. (2009). Semantic hashing. International Journal of Approximate Reasoning, 50(7), 969-978.
[4] Chaidaroon, Suthee and Fang, Yi, Variational Deep Semantic Hashing for Text Documents, SIGIR '17 Proceedings of the 40th International ACM SIGIR Conference on Research and Development in Information Retrieval
[5] Q Wang, D Zhang, L Si - Proceedings of the 36th international ACM, 2013 - dl.acm.org Semantic hashing using tags and topic modeling
[6] Doctoral dissertation, Karol Grzegorczyk, Vector representations of text data in deep learning, Kraków, 2018
[7] Järvelin, Kalervo and Kekäläinen, Jaana, Cumulated Gain-based Evaluation of IR Techniques, ACM Trans. Inf. Syst. 2002.